Dice Rolling Probabilities
If you’d like to visualize the probable outcomes of rolling some
number of dice of a specified type, probability_plot is
here for you! You can specify the number and type of dice and the number
of times to roll that group. The median outcome is indicated by a dashed
vertical line.
# Make a probability plot for two, six-sided dice
dndR::probability_plot(dice = "2d6", roll_num = 499)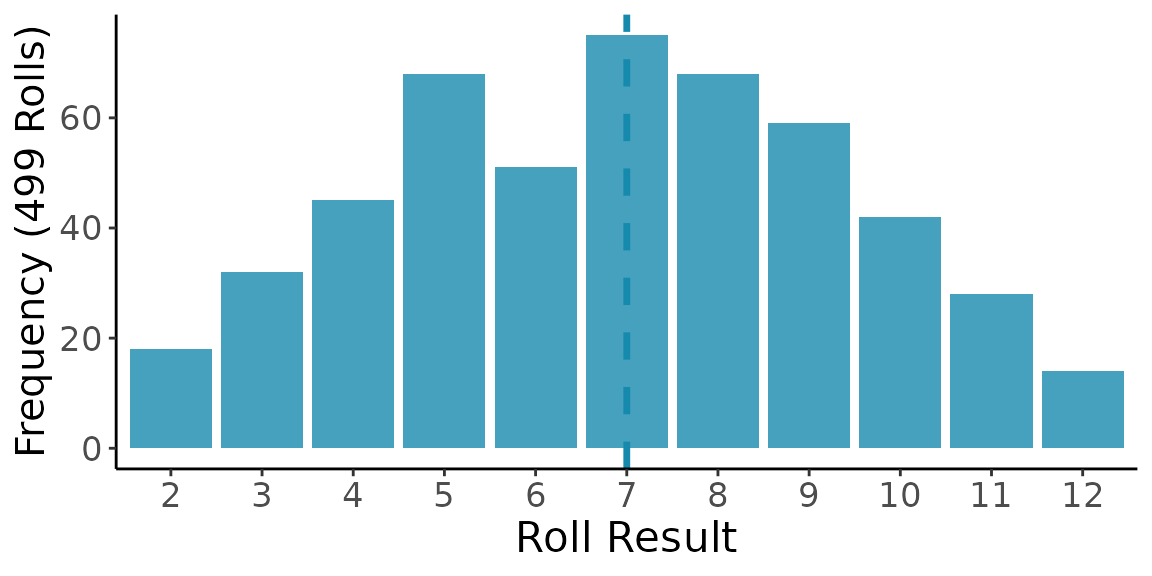
Just for fun, the graph colors are decided by the type of dice you specify and correspond to the hex logo of this R package!
Assessing Party Abilities
It can be useful as a DM to know where your players’ strengths and
weaknesses lie across the whole party. party_diagram allows
DMs to visualize the ability scores of every player in a party either
grouped by player or by ability score. The function supports both
interactive (abilities entered via the R Console) and non-interactive
(abilities given as a list) entries.
Thank you to Tim Schatto-Eckrodt for contributing this function!
Due to the static nature of a vignette, we’ll use the non-interactive path by assembling the party score list and then invoking this function.
# Create named list of PCs and their scores
party_list <- list(Vax = list(STR = "10", DEX = "13", CON = "14",
                              INT = "15", WIS = "16", CHA = "12"),
                   Beldra = list(STR = "20", DEX = "15", CON = "10",
                                 INT = "10", WIS = "11", CHA = "12"),
                   Rook = list(STR = "10", DEX = "10", CON = "18",
                               INT = "9", WIS = "11", CHA = "16"))

# Create a party diagram using that list (by player)
dndR::party_diagram(by = "player", pc_stats = party_list, quiet = TRUE)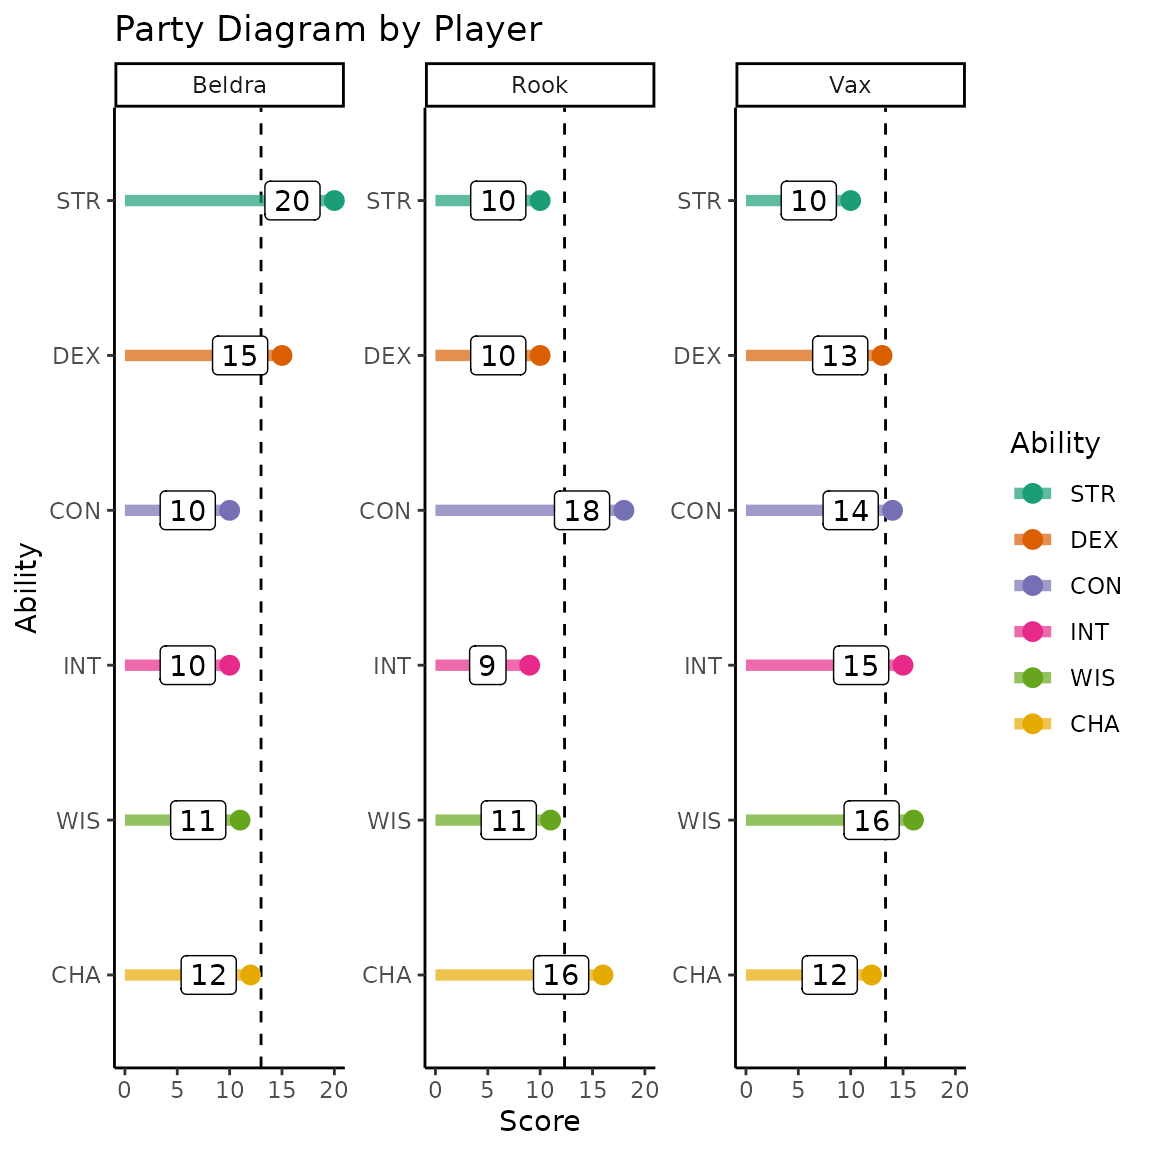
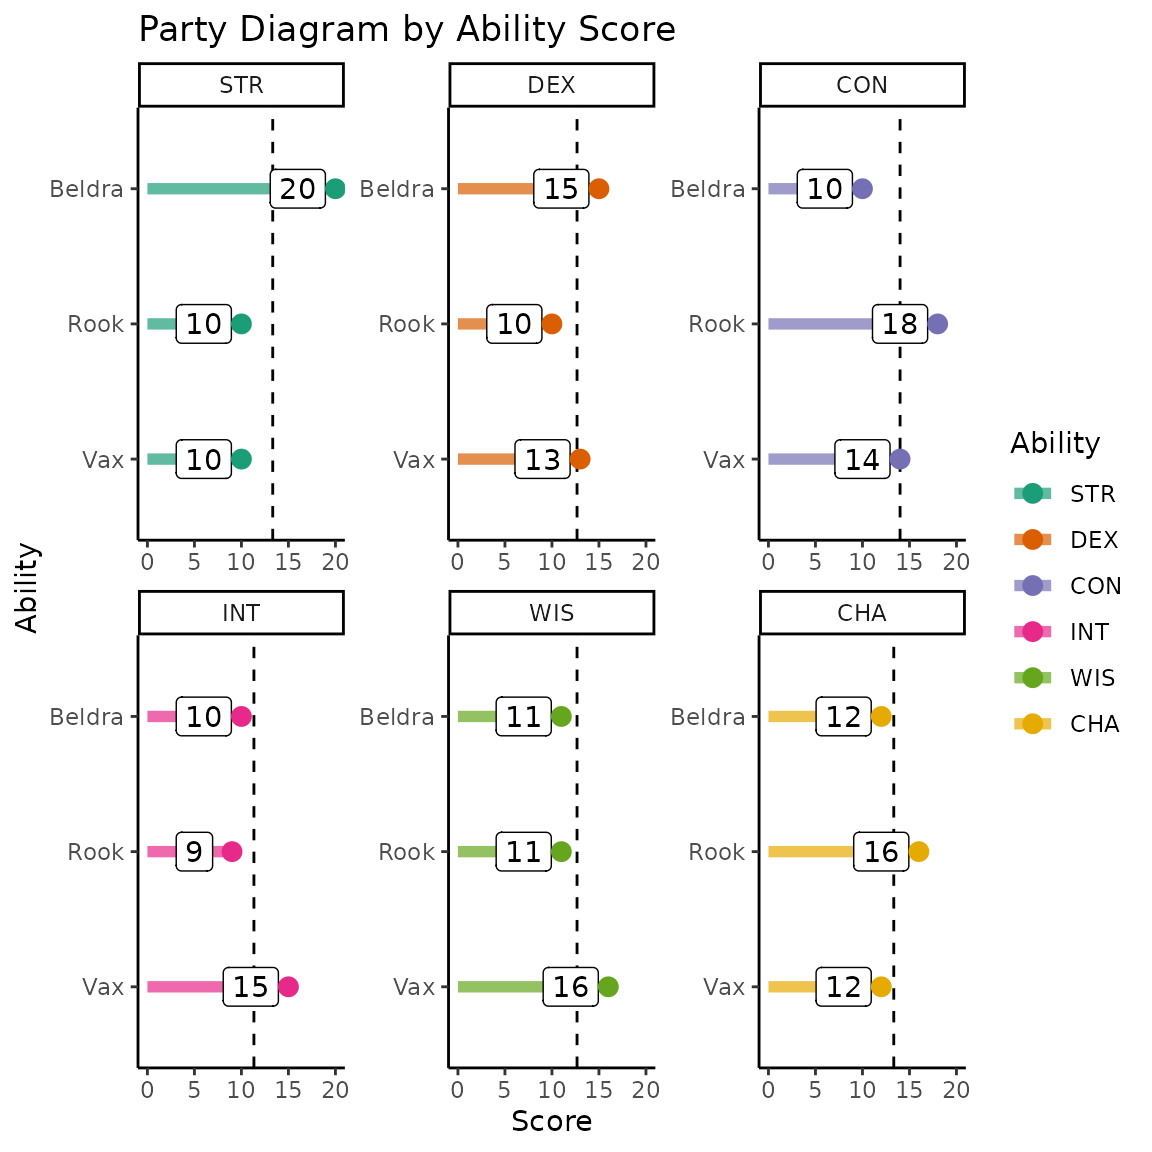
You can also group the diagram by ability score if that is of interest instead.
# Party diagram grouped by ability score
dndR::party_diagram(by = "ability", pc_stats = party_list, quiet = TRUE)