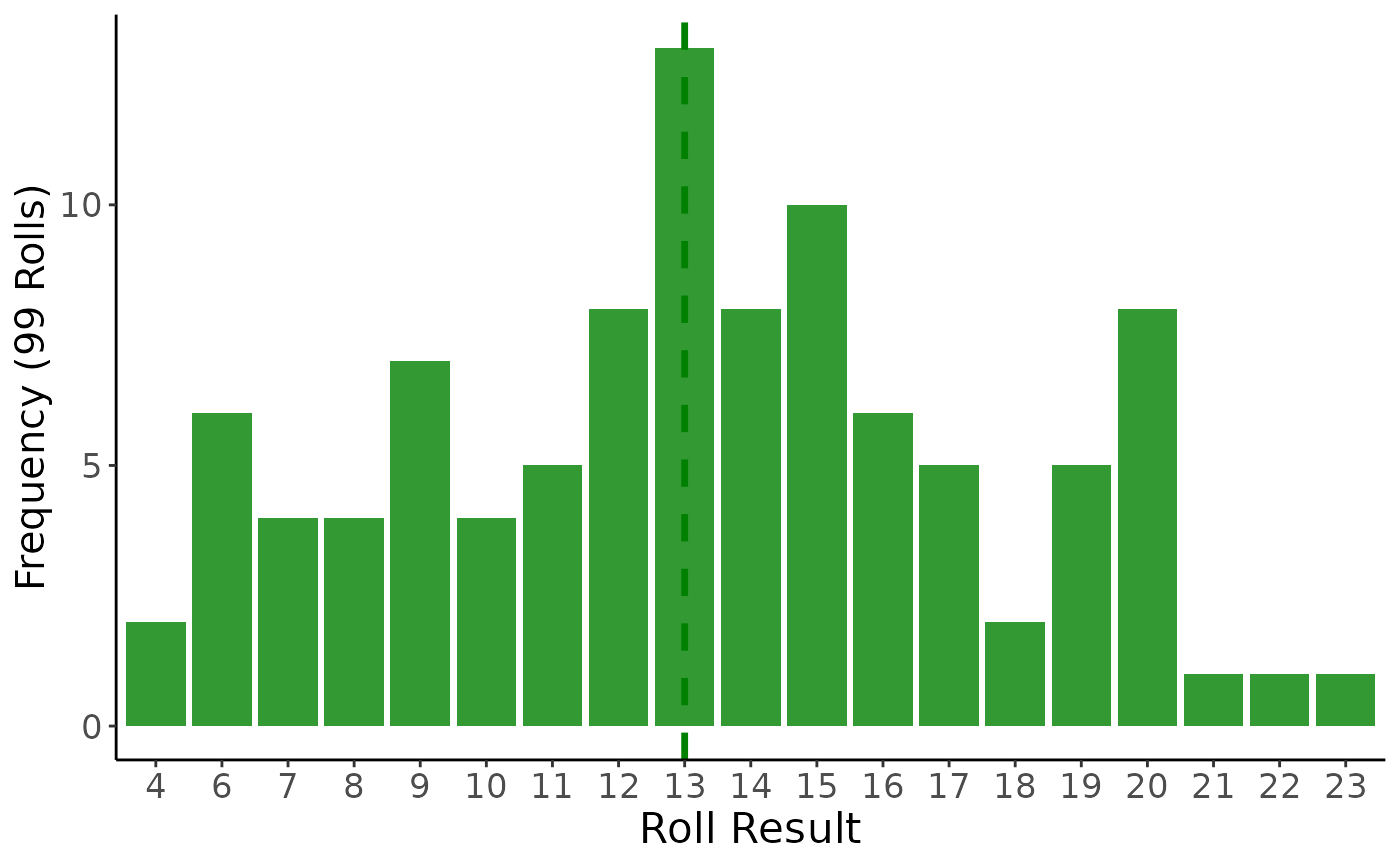
Input the number and type of dice to roll and the number of times to roll the dice. This is used to generate a plot of the real distribution of dice outcomes and create a ggplot2 plot of that result. A vertical dashed line is included at the median roll result. Note that low numbers of rolls may not generate realistic frequencies of outcomes
Usage
probability_plot(dice = "2d20", roll_num = 999)
Arguments
- dice
(character) specifying the number of dice and which type (e.g., "2d4" for two, four-sided dice). Defaults to two, six-sided dice
- roll_num
(integer) number of times to roll the specified dice to generate the data fro the probability plot. Defaults to 999
Value
(ggplot object) roll outcome frequency as a ggplot2 object
Examples
# Generate a probability plot of 3d8
dndR::probability_plot(dice = "3d8", roll_num = 99)