Intro to Data Science

Lab 8 – Biodiversity + Mapping Resources

A Guide to Your Process

Scheduling

Learning Objectives

Practice

Supporting Information

Class Discussion

Today’s Plan

  • Muddiest Point Review
  • Biodiversity & Ecological Communities
  • Future Resources
    • Including mapping & geospatial in R!

Today’s Learning Objectives

After today’s session you will be able to:

  • Calculate diversity and species richness with R
  • Compute rarefied species richness
  • Create a species accumulation curve with ggplot2
  • Identify useful parts of The Carpentries’ tutorials

Muddiest Point Review

  • Recurring topics from most recent MPs:


  • What other topic(s) would you like to review?

Ecology Term Glossary

  • Population = individuals of one species in a given habitat / area


  • Community = individuals of multiple species in a given habitat / area


  • Abundance = number of individuals of one or more species


  • Richness = number of species in a given habitat / area


  • Diversity = index derived from some combination of abundance & richness

Ecological Questions

  • As ecologists, we’re often concerned with biodiversity


  • Our studies often involve data like:
    • Presence or abundance of particular species
    • Number or mix of species in a habitat
    • Habitat characteristics across multiple habitats
    • Scaling the above across space or time (or both!)


  • A lot of different questions fit under the “ecology” umbrella!

Ecology Data in R

  • Ecological data are famously “messy”
    • A lot of field-collected information
    • Often multiple observers with their own abbreviations or acronyms
    • Many typos or inconsistencies
    • A lot of required processing before data can be visualized / analyzed


  • Even when everything goes right, ecology data has a lot of variation
    • The natural world has a lot of “noise” in the data


  • Challenge is separating biologically-relevant noise from scientists’ errors!

Ecology R Package

  • A lot of data wrangling can be done with whatever package you’d like
    • E.g., dplyr, tidyr, base R, etc.


  • Some of the special metrics unique to ecology need their own package


  • Most of these tools live in the vegan package!


  • Note on package name
    • Pronounced like the dietary preference
    • Short for “vegetation analysis” (developed by plant people)

Diversity Metrics

Shannon Diversity

  • Higher numbers = more diverse
  • Theoretically infinite


  • Abbreviation is H’
    • “H prime”

Diversity Metrics

Shannon Diversity

  • Higher numbers = more diverse
  • Theoretically infinite


  • Abbreviation is H’
    • “H prime”

Simpson Diversity

  • Ranges from 0 to 1


  • Abbreviation is D

Diversity Metrics

Shannon Diversity

  • Higher numbers = more diverse
  • Theoretically infinite


  • Abbreviation is H’
    • “H prime”

Simpson Diversity

  • Ranges from 0 to 1


  • Abbreviation is D

Species Richness

  • Number of species
  • Regardless of number of individuals


  • Abbreviation is S

Calculating Diversity in R

  • Functions are diversity and specnumber


  • Example syntax:
# Calculate diversity
vegan::diversity(x = community_df, index = "shannon")

# Calculate richness
vegan::specnumber(x = community_df)


  • Note that the community data needs to be in wide format
    • Row = site / location
    • Column = species (either presence/absence or abundance)

Community Data in vegan

  • vegan has some built-in community datasets


  • We’ll use a tree dataset from Barrow Colorado Island (BCI)
    • Hyper-diverse island in Panama
    • Site of a lot of groundbreaking ecological work


  • Dataset is one row per sampling site
    • Columns are tree scientific names
    • Values are counts of tree species at that site

Practice Prep

  • Get prepared
    • Make a new script for today
    • Install/load vegan package
    • Load BCI data by running the following code:
data(BCI)
  • Check structure of BCI object


  • Calculate number of tree species per site (i.e., per row)
    • Use the specnumber function in vegan


  • How many tree species are in the first site?

Calculate Diversity

  • Calculate Shannon diversity for the BCI data
    • What is the Shannon diversity for the first site?


  • Calculate Simpson diversity for the BCI data
    • What is the Simpson diversity for the first site?
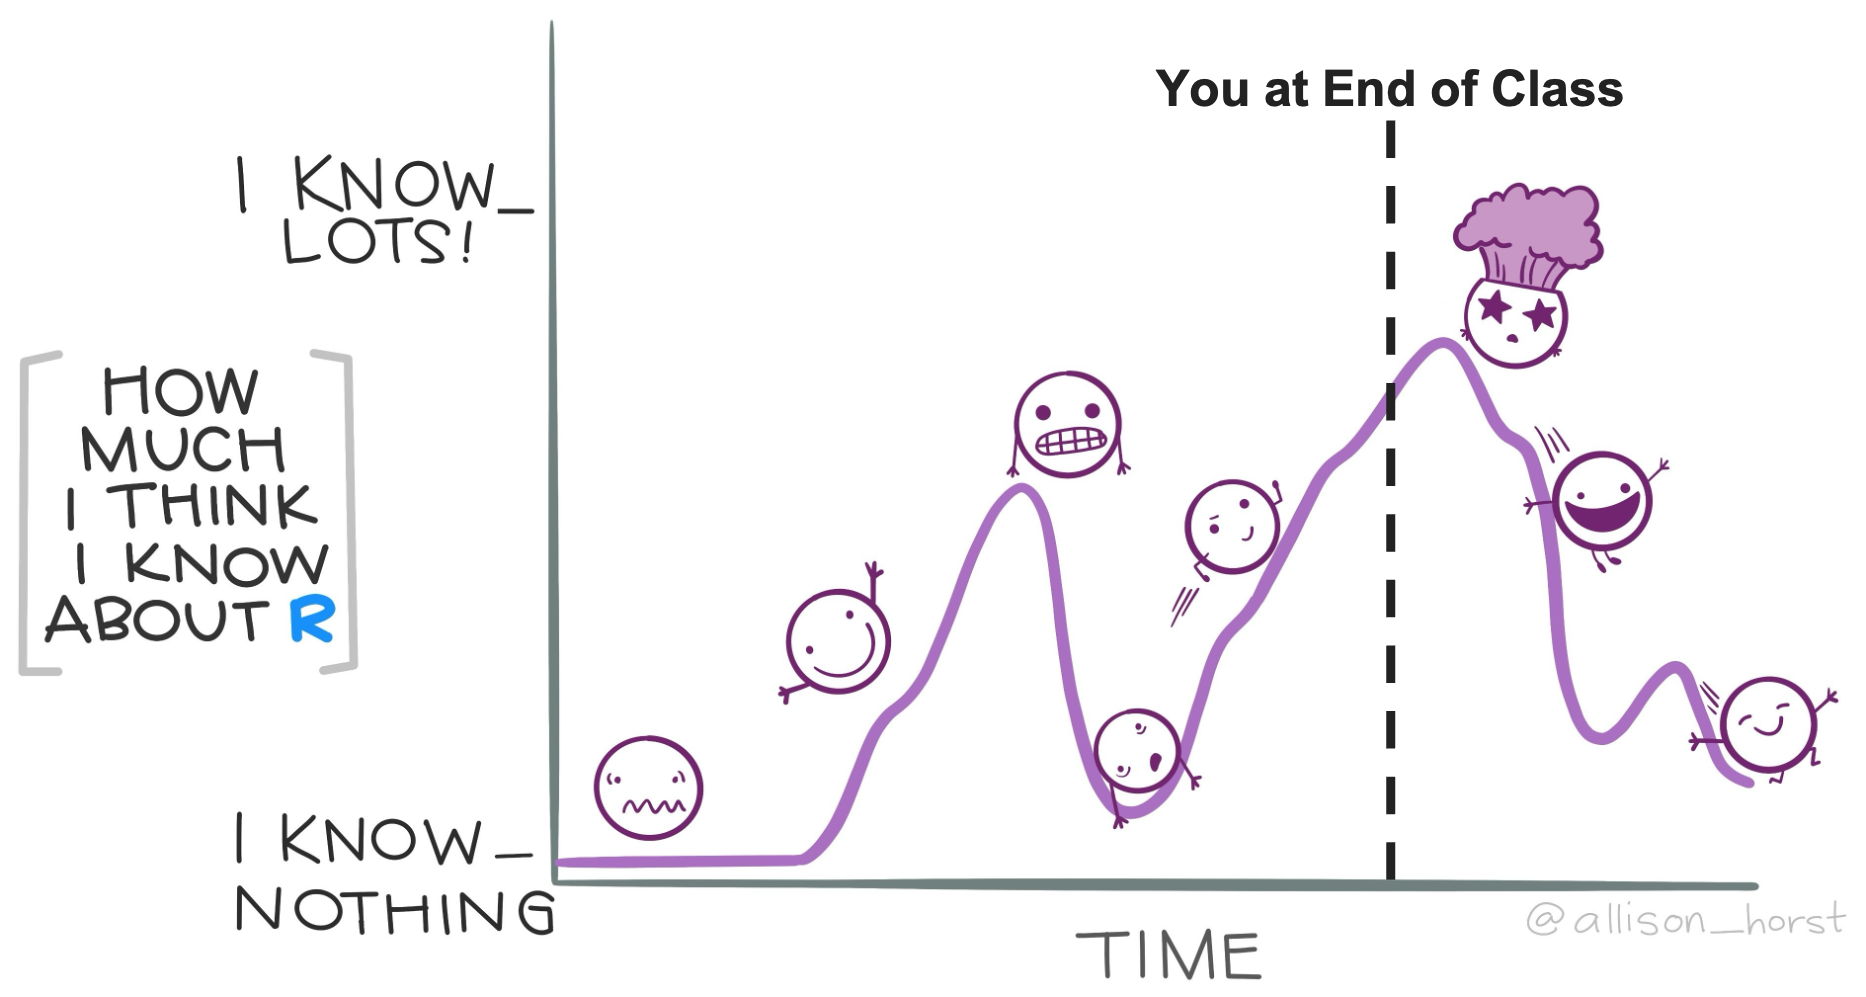
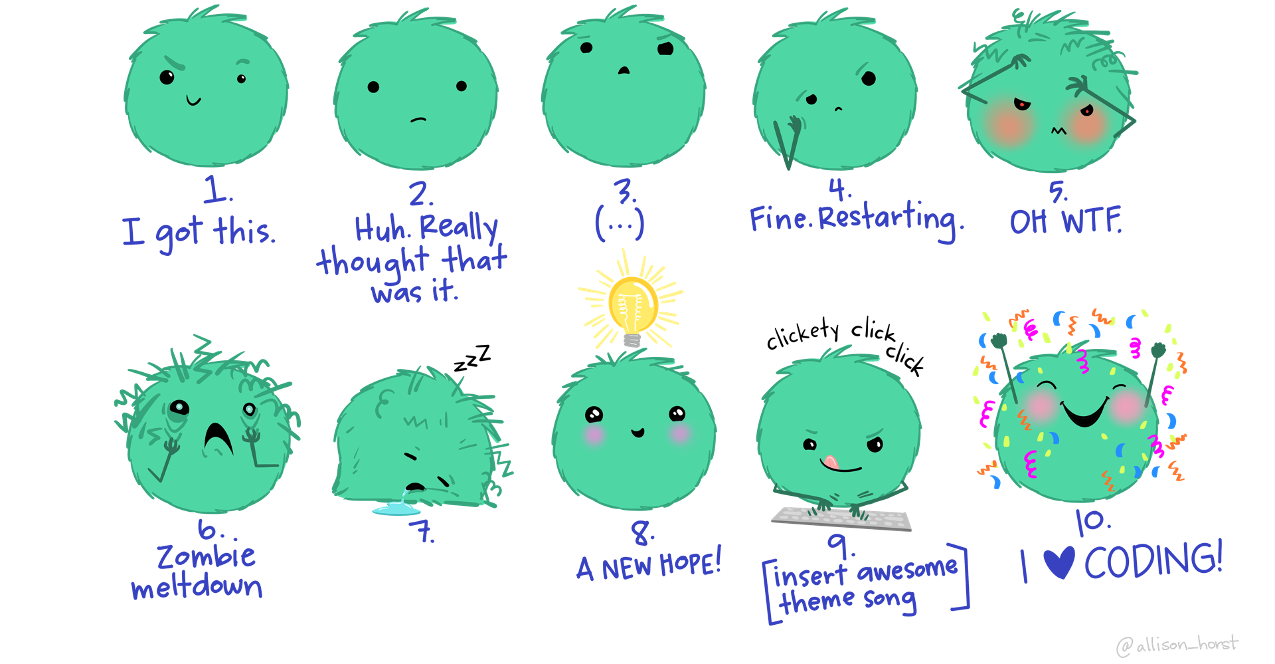
Temperature Check

How are you Feeling?

Comic-style graph depicting someone's emotional state as they debug code (from initial struggle and defeat to eventual triumph)

Rarefaction Background

  • Known issue: inconsistent survey effort yields inconsistent data
    • If you look harder for species at site A than B, you’ll likely find more at A than B


  • Rarefaction = way to (try to) account for this difference
    1. Identify site with smallest abundance of individuals (any species)
    2. Randomly pick that many individuals from sites that have more than that number
    3. Measure diversity of that random subset
    4. Re-randomize many times
    5. Average the diversity found in each random subset to get “rarefied” richness

Rarefaction with R

  • Function for rarefaction in vegan is rarefy


  • Example syntax:
# Rarefy our community data
vegan::rarefy(x = community_df,
              # `sample` argument is minimum abundance
              sample = min(community_df$abundance))


  • Produces non-integer richness but that is not a problem
    • Scientists expect non-integers when you say you’ve rarefied the community

Rarefy a Community

  • Rarefy the BCI data (set sample to 20)
    • What is the rarefied richness of the first site?
    • How does this compare with the actual richness of the first site?


  • Let’s identify the actual lowest abundance of trees
    • Run rowSums(BCI) and assign it to an object
    • Use min on that object to identify the single smallest value


  • Rarefy the community again but set sample to the minimum value you found
    • How does the rarefied richness of the first site change?

Species Accumulation Curves

  • How do you know when you’ve sampled “enough”?


  • When you start sampling you find a ton of new species at first
    • Then fewer new species over time


  • We can use that trend to quantify how much we need to sample to find “most” of the species


  • These data are presented as a Species Accumulation Curve (SAC)

SAC Example

Making a SAC

  • Function for SACs in vegan is specaccum


  • Example syntax:
vegan::specaccum(comm = community_df)


  • One additional hurdle for this function: it returns a list
    • A list is a class of object
    • Essentially a list is a vector of some other class (vectors, dataframes, etc.)


  • We will cover how to pull what we want out of this list

Calculate Species Accumulation

  • Use specaccum on the BCI data and assign it to a new object


  • Check the structure


  • What differences do you see here from what we’ve done in the past?

Handle the List

  • That worked but–as I warned you–you are left with a list
    • ggplot2 will want a dataframe so we need to do some parsing


  • Run the following code:
curve_df <- data.frame("sites" = curve_list$sites,
                       "richness" = curve_list$richness,
                       "sd" = curve_list$sd)
  • curve_list should be whatever you named your species accumulation object


  • Check the structure of the resulting data object

Make a SAC

  • Use ggplot2 to make a graph with:
    • The curve dataframe (not the list!) as the data
    • Map site number to X axis
    • Map richness to Y axis
    • Customize theme elements in ways that spark joy for you


  • What does your graph look like?


  • For fun, you can map color to sites
    • Makes a prettier graph (in my opinion)

New ggplot2 Geometry

  • Time to learn one more geometry: error bars (geom_errorbar)


  • Example syntax:
# Make plot
ggplot() +
  # Add (vertical) error bars
  geom_errorbar(aes(ymin = y - g,
                    ymax = y + g),
                width = 0.5)


  • Further explanation
    • y = name of column mapped to Y axis
    • g = name of column to add/subtract from Y axis
    • width = how wide you want the crossbars on the error bars

Add Error Bars

  • Add the errorbar geometry to your existing graph
    • Reminder: geom_errorbar


  • Inside aes parentheses ymin/ymax should +/- the “sd” column
    • Set width to whatever you’d like


  • What does your final graph look like?

Temperature Check

How are you Feeling?

Comic-style graph depicting someone's emotional state as they debug code (from initial struggle and defeat to eventual triumph)

Continuing to Explore R

  • You all have tackled a wide array of R tasks in this course!


  • Even so, we’ve barely scratched the surface of what you can do in R


  • If you want to continue your R journey (which I hope that you do!), there are a lot of good resources out there


  • The big one is: The Carpentries

The Carpentries

  • What are The Carpentries?
    • Free, open-source tutorials for specific coding skills
    • Developed/maintained by educators with clear learning objectives


  • Consistently high quality and up-to-date


  • Data Carpentry Lessons (datacarpentry.org/lessons) including:
    • Data Skills for Ecologists
    • Working with Genomics Data
    • Geospatial Data + R
    • And many, many more!

My Goal for You

From Lecture 1!

Comic-style graph depicting someone's confidence with R changing over time

Your Accomplishments

  • In this class, you have done the following:
    • Made and manipulated data
    • Created R scripts and RMarkdown reports
    • Explored version control & GitHub
    • Performed statistical tests
    • Written loops and your own custom function(s)
    • And so much more!


  • If you have a CV/resume, definitely add:
    • Some (or all!) of these skills
    • Link to your GitHub profile

Closing Thoughts

  • I had a lot of fun this summer with y’all!


  • Your development as data scientists has been amazing to witness


  • I particularly loved how you all engaged with the Function Tutorials
    • You really made it your own
    • Found the intersection of your interests and R functions


  • Do you have any last R / data things to discuss?

Upcoming Due Dates

  • Everything must be turned in at midnight tonight!


  • Turn in everything you haven’t yet as soon as possible