Intro to Data Science
Statistics Justification Example
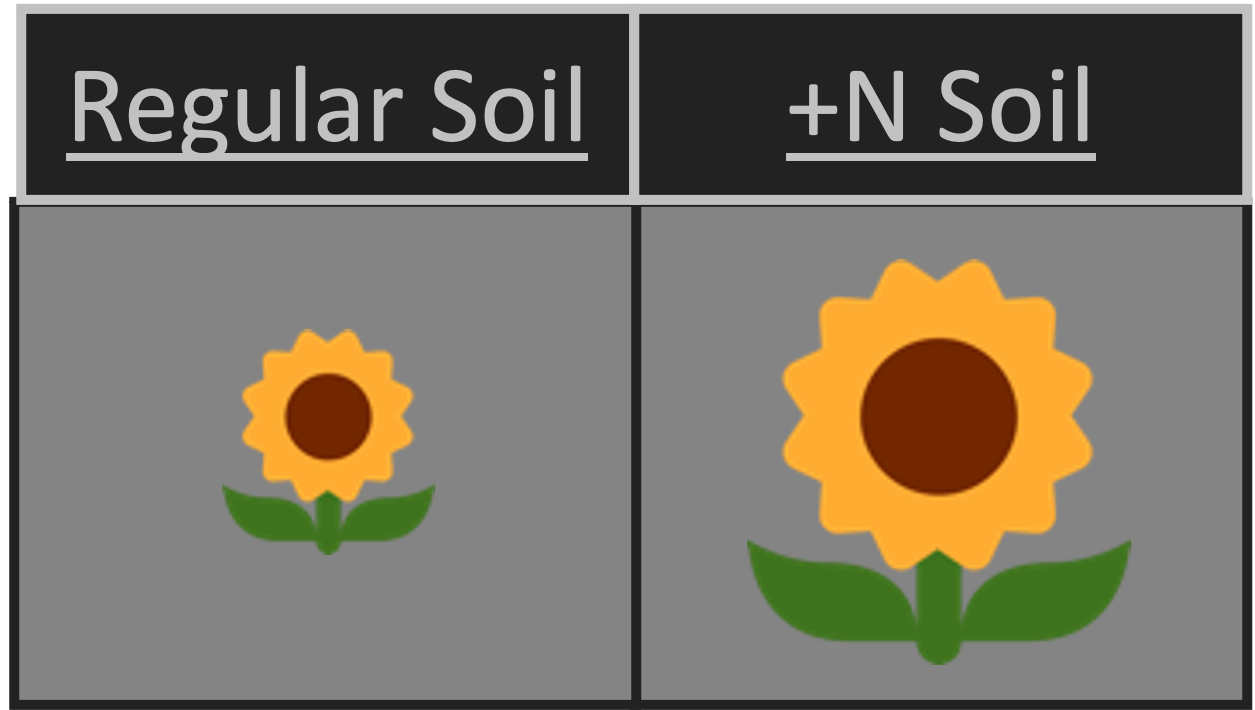
- Hypothesis: adding Nitrogen (N) to soil will make sunflowers grow taller
- Test: Grow many sunflowers either with or without adding a set amount of N to the soil
- Data: After set number of days, measure height of all sunflowers
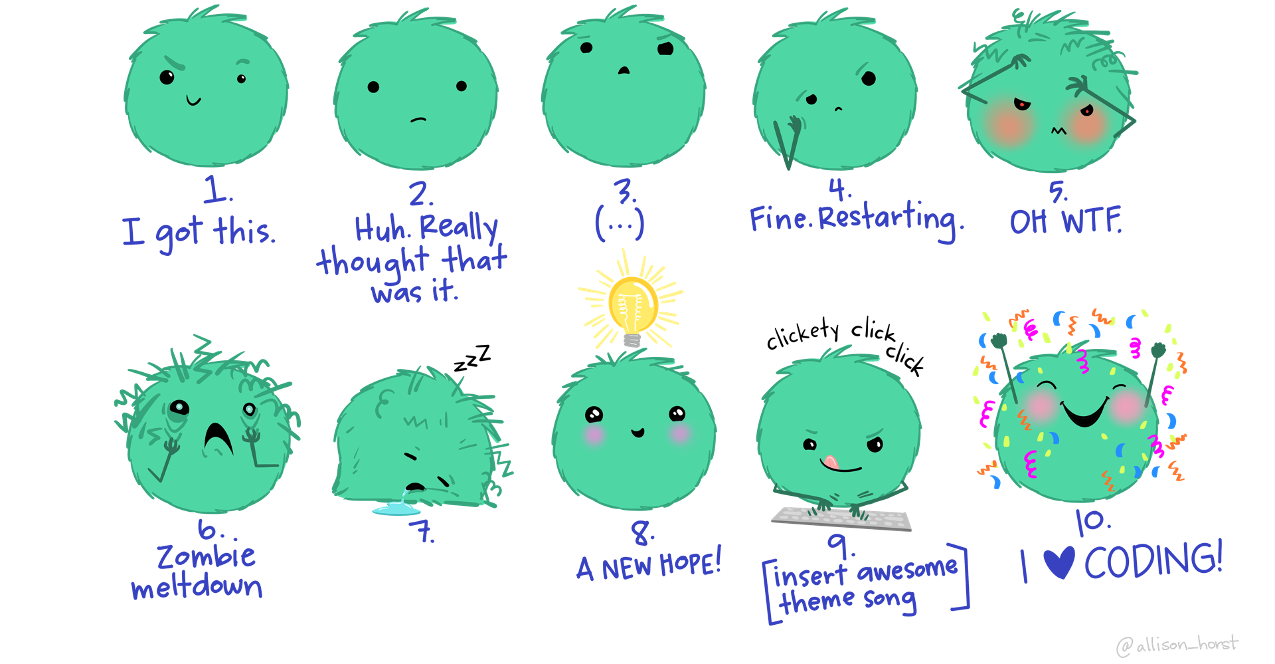
Temperature Check
How are you Feeling?
Temperature Check
How are you Feeling?
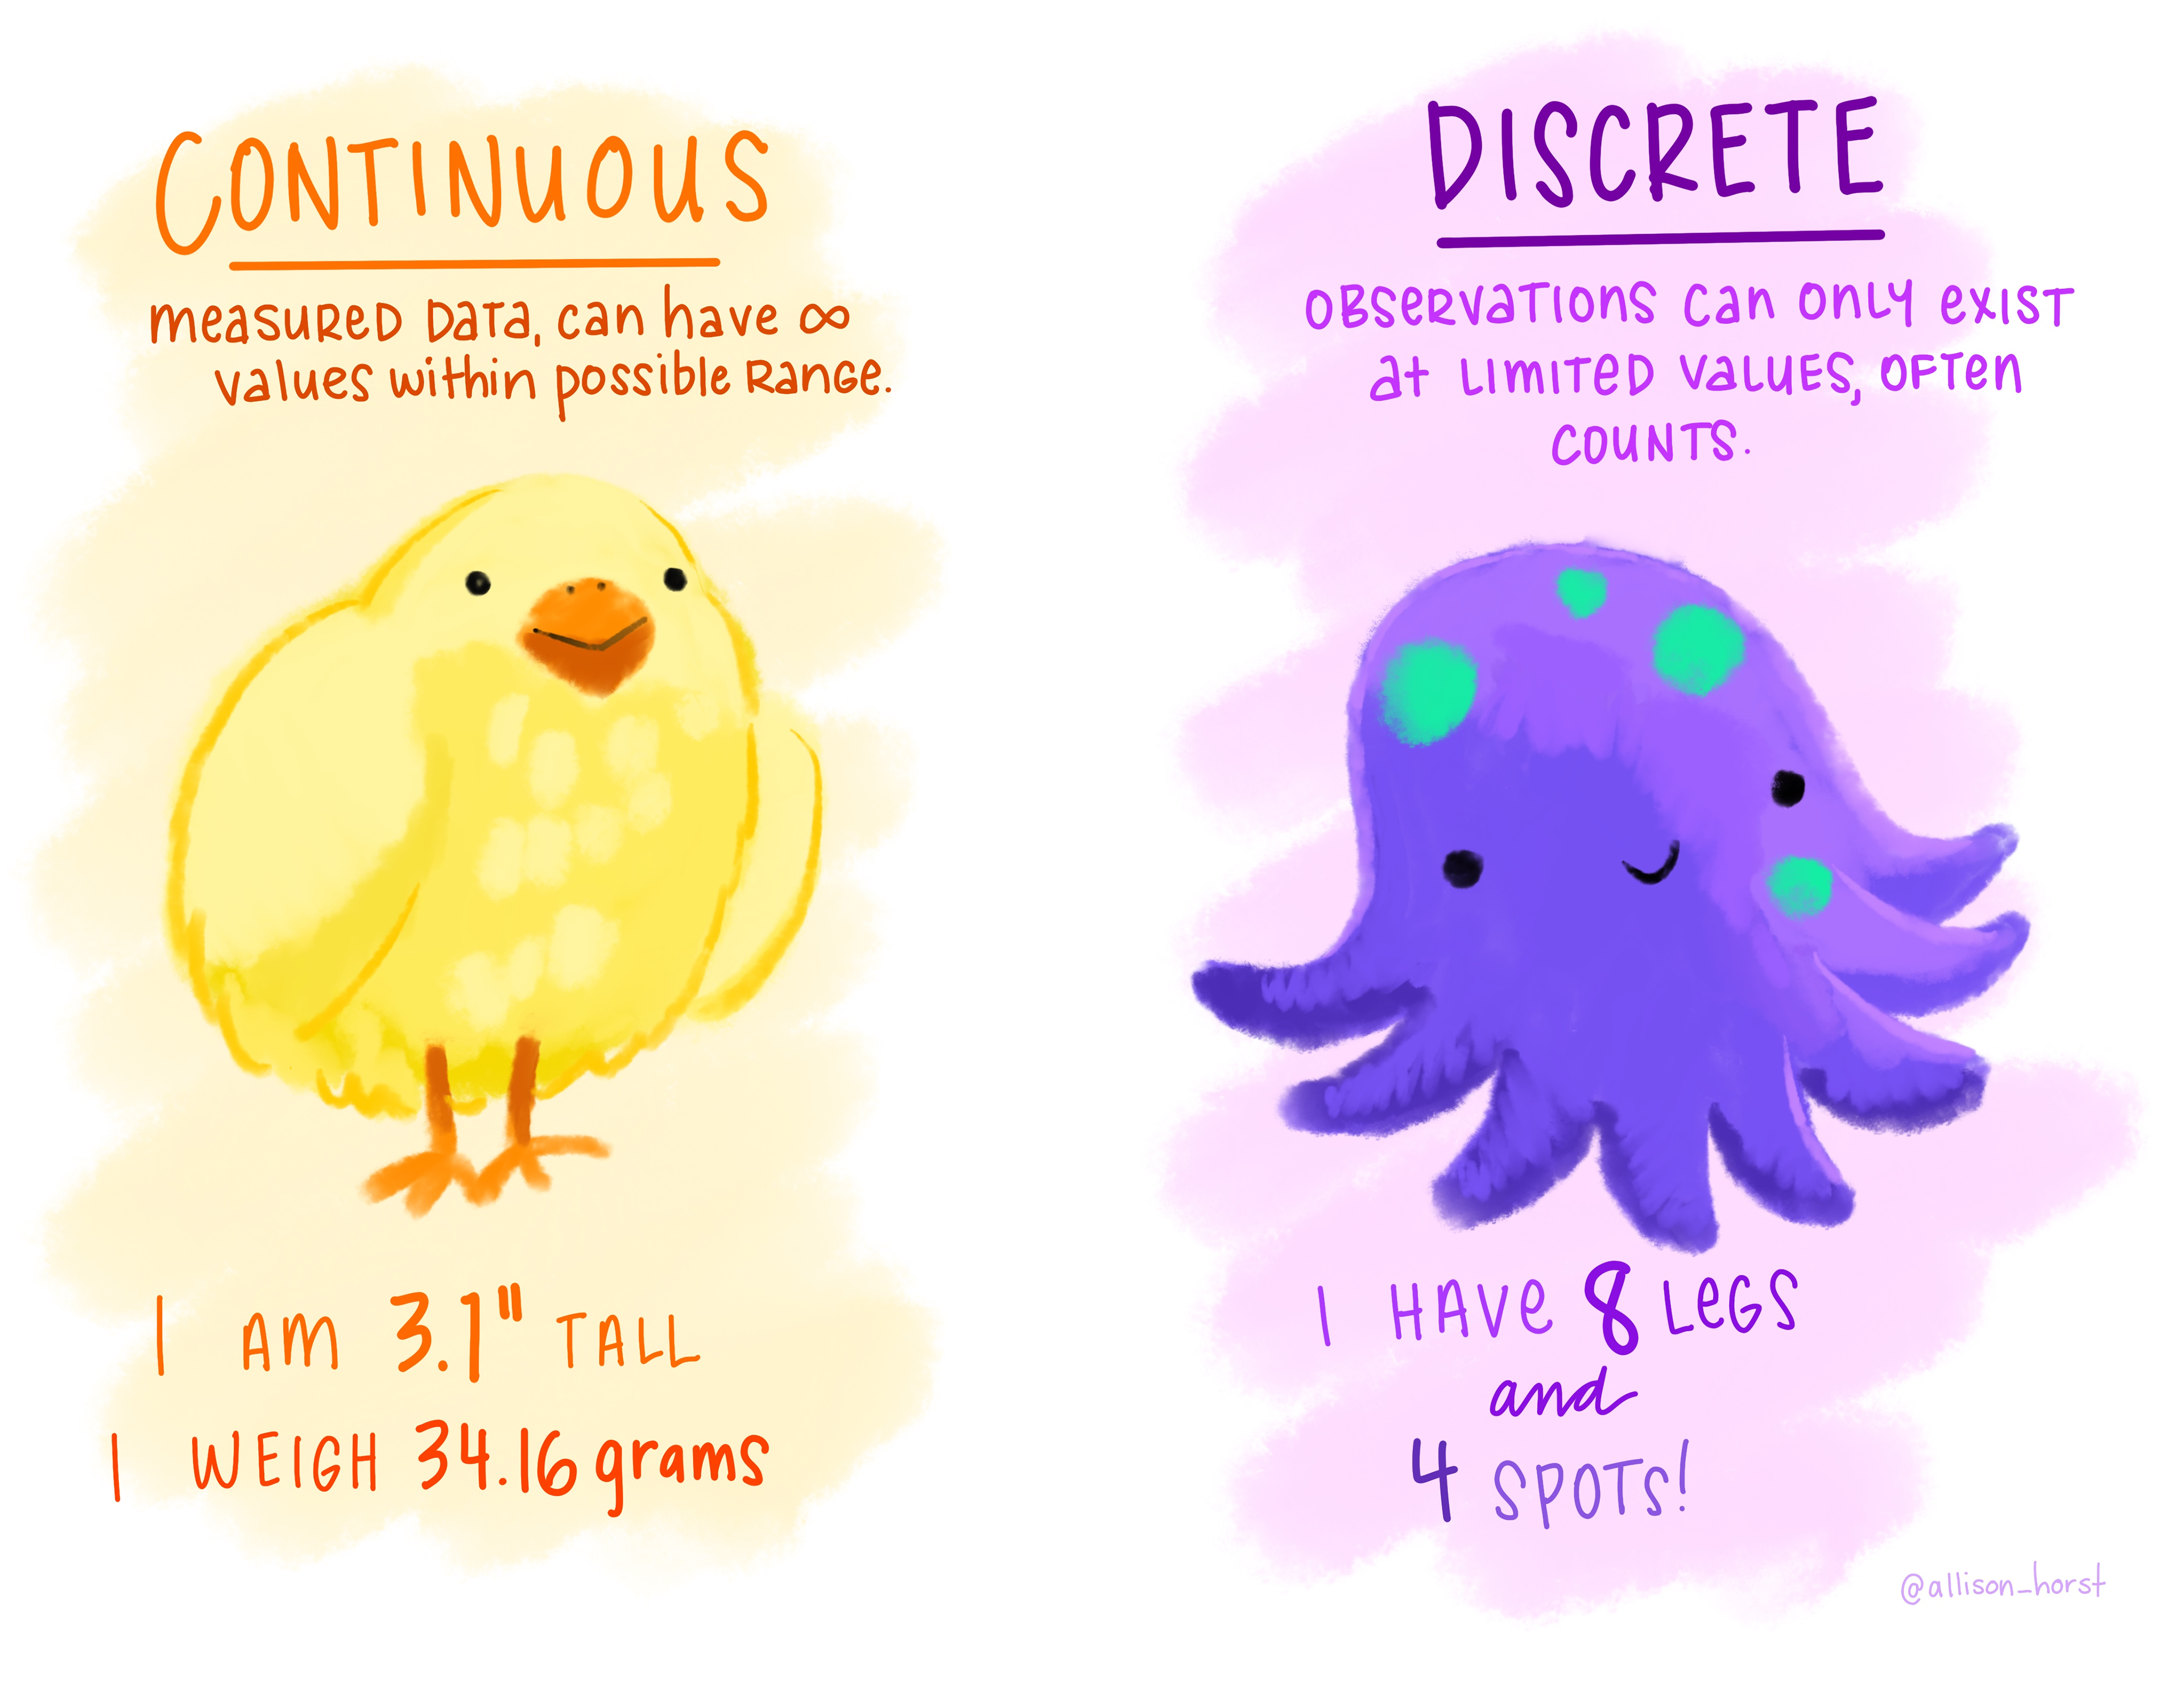
Variable Types Visual
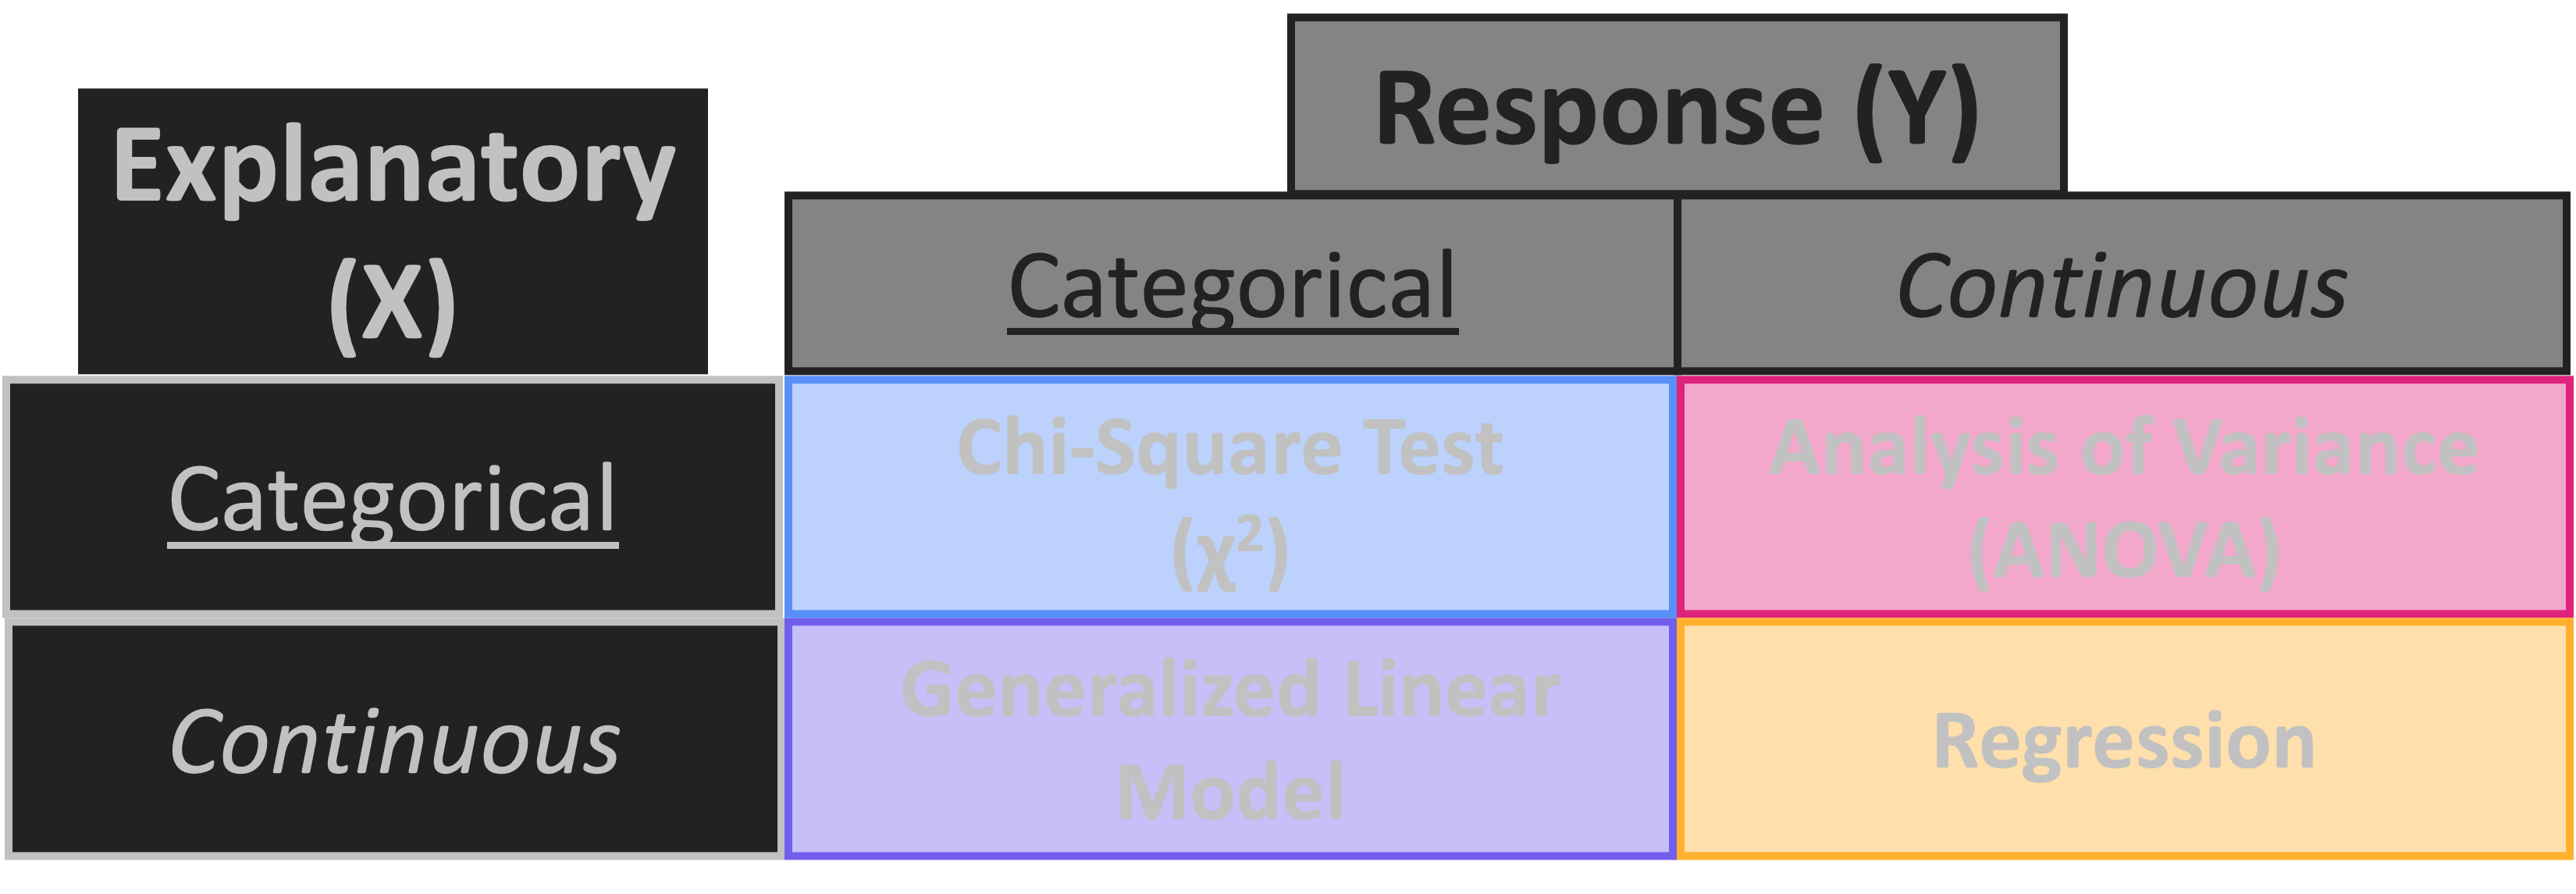
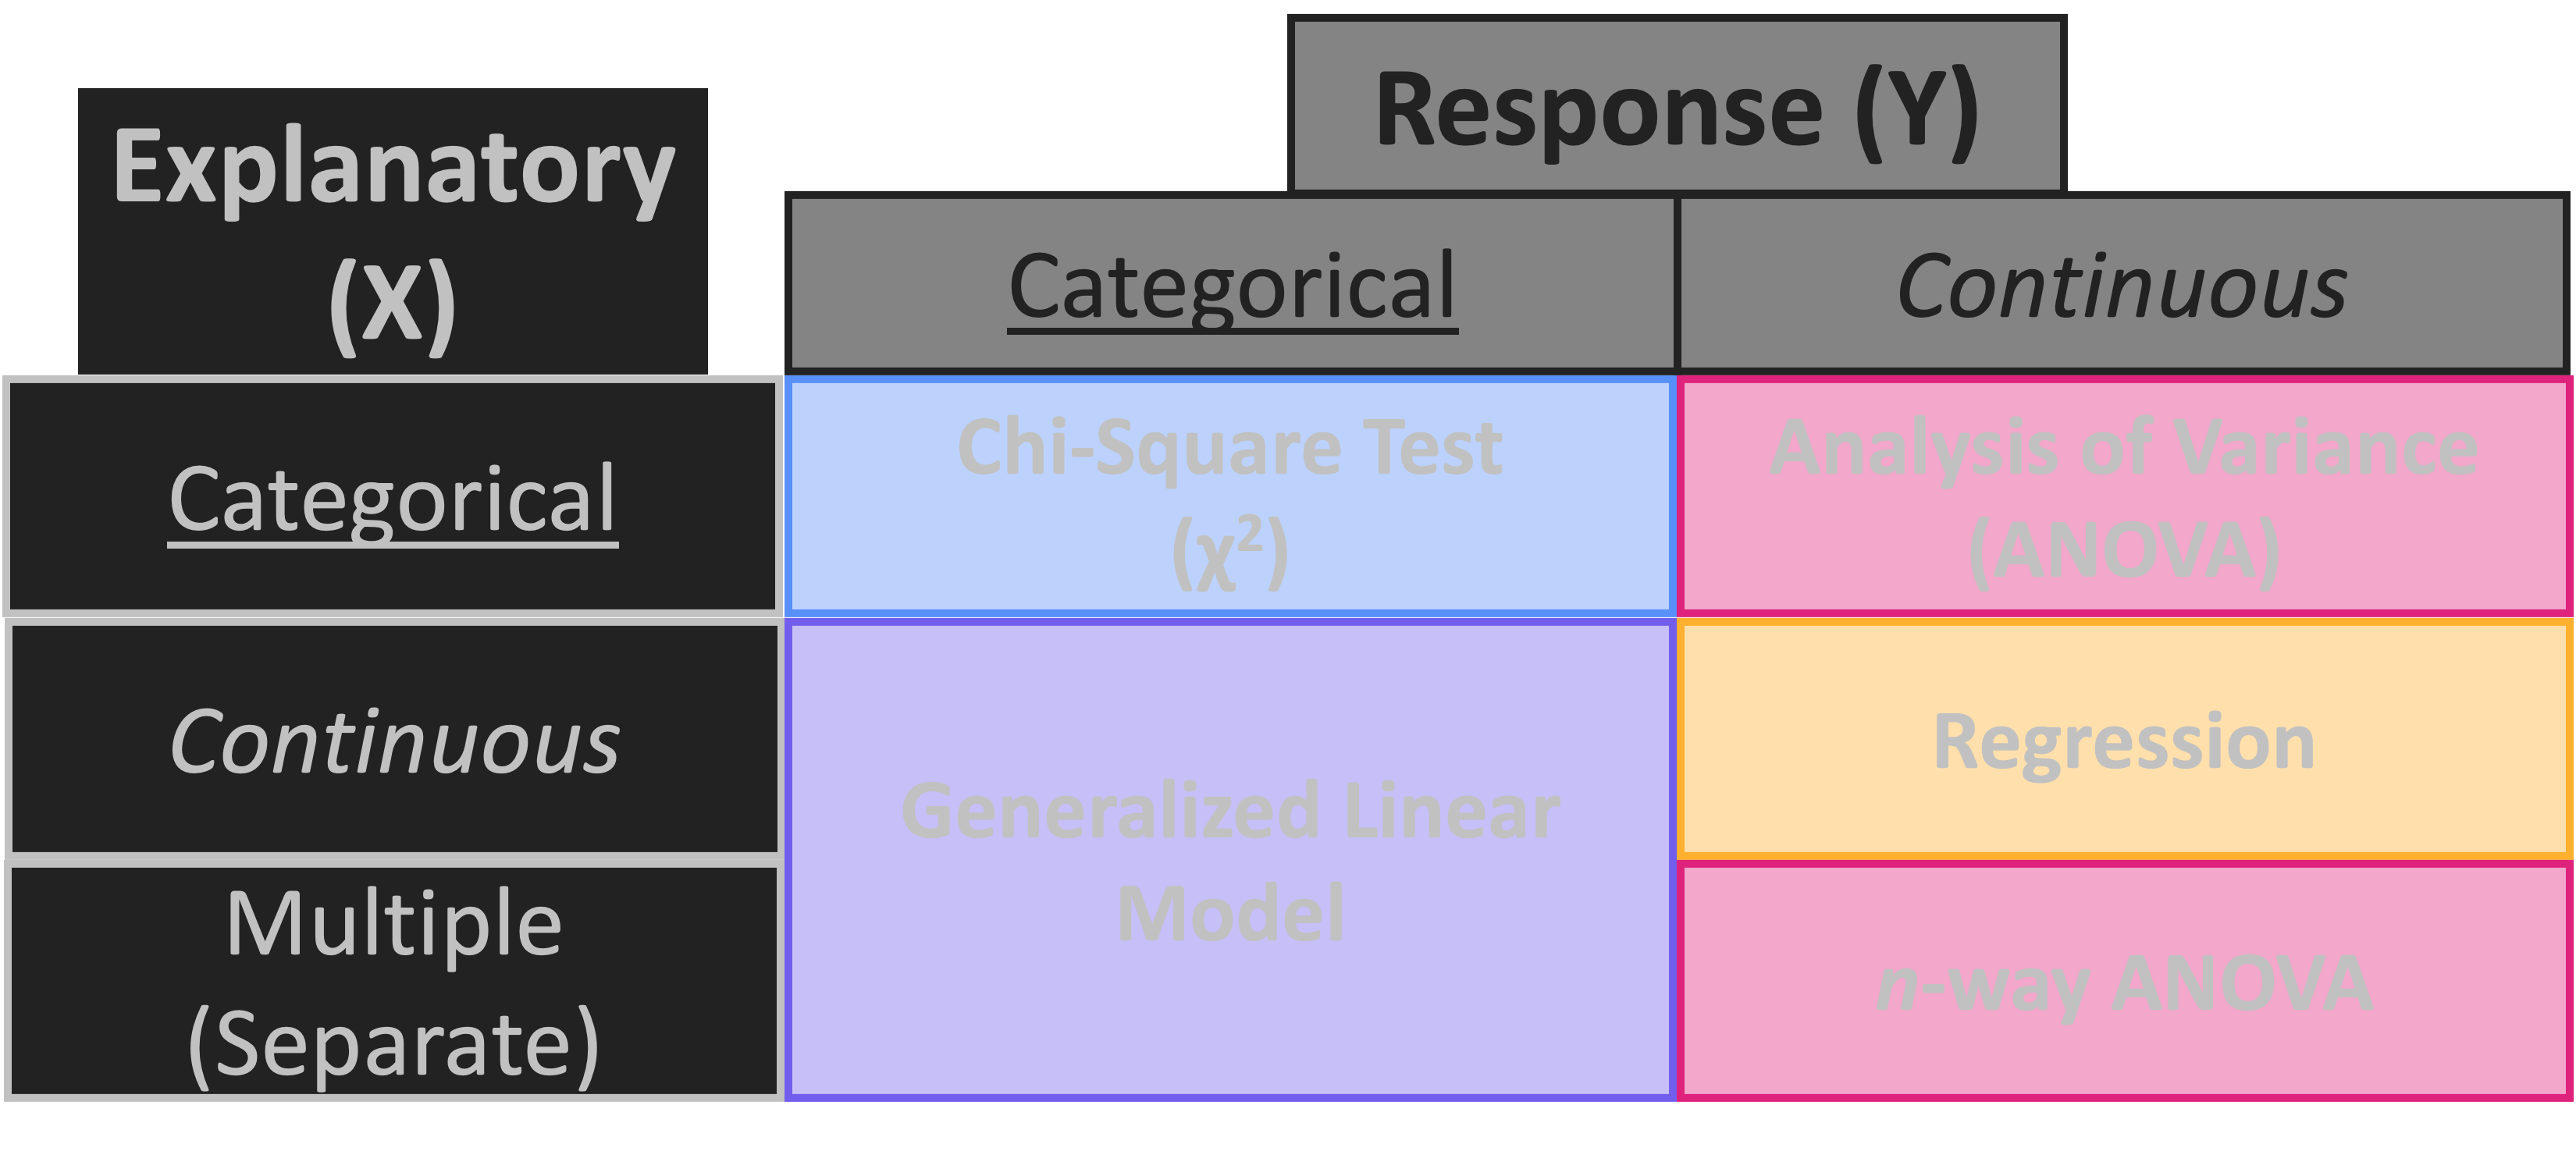
Statistics Roadmap

Regression Visual
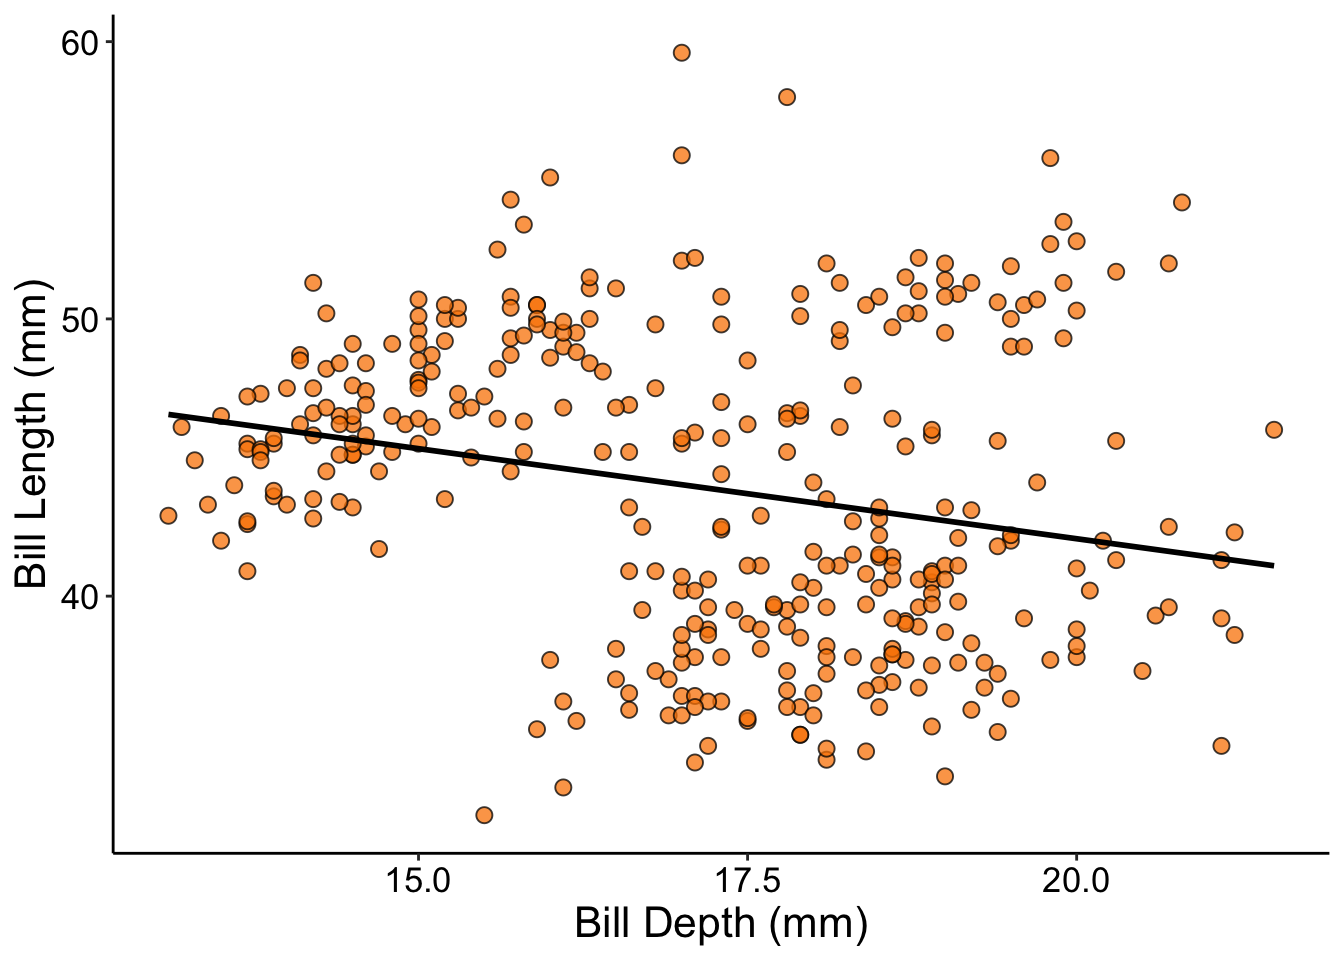
Practice: Regression

- You are studying penguins and want to test the following hypotheses:
- HA: As penguin bill length increases, bill depth decreases
- H0: Bill length and bill depth have no relationship
- Use a regression to test the hypothesis and assign it to an object
- What is the class of that object? What is its structure?
- Run the
summaryfunction on that object to get a human readable summary table
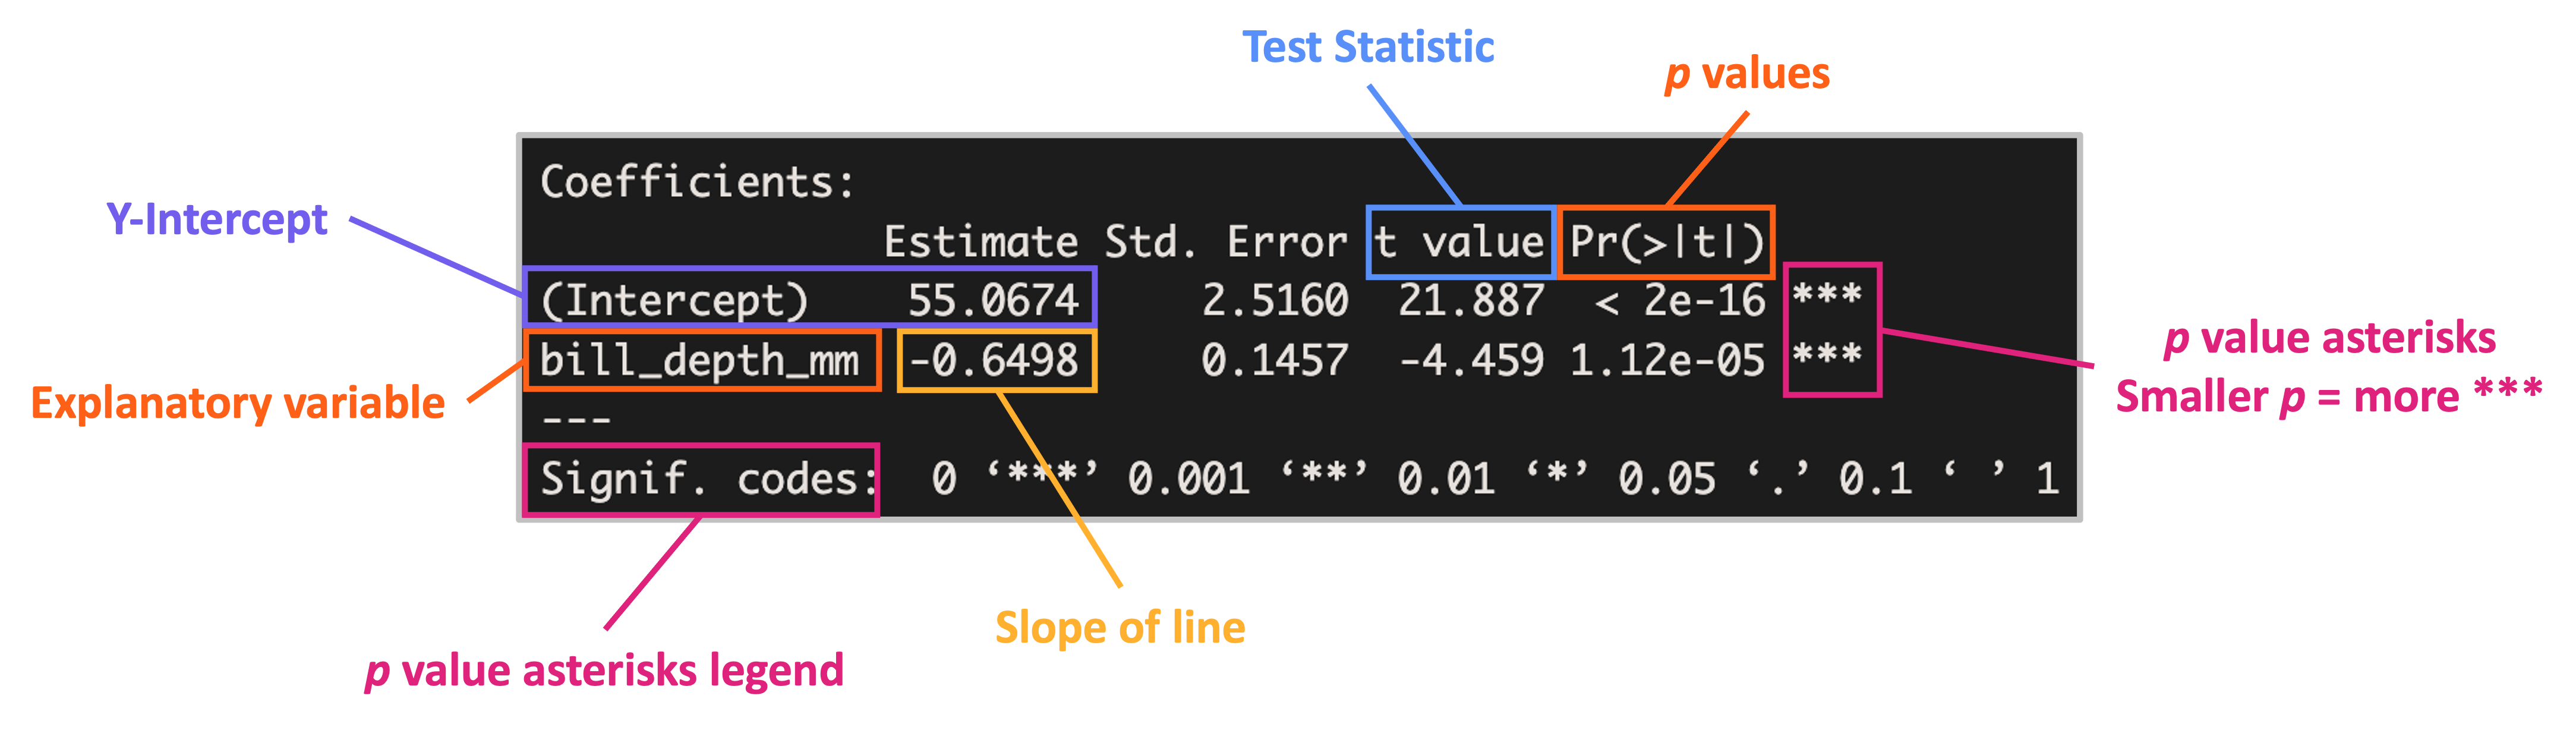
Interpreting Summary Tables
- You (maybe): “Okay, cute summary table but is our hypothesis supported or not?”
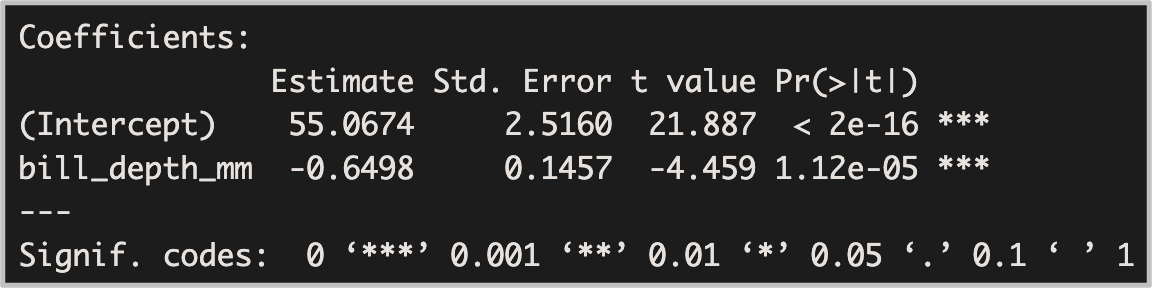
Interpreting Summary Tables
- You (maybe): “Okay, cute summary table but is our hypothesis supported or not?”
ANOVA Visual

Practice: ANOVA
- You are still studying penguins but have new hypotheses:
- HA: Penguin species have different flipper lengths
- H0: Penguin species do not have different flipper lengths
- Use an ANOVA to test the hypothesis and assign it to an object
- What is the class of that object? What is its structure?
- Use the
summaryfunction to see if your hypothesis was supported- What difference(s) do you see between this and the regression summary table?
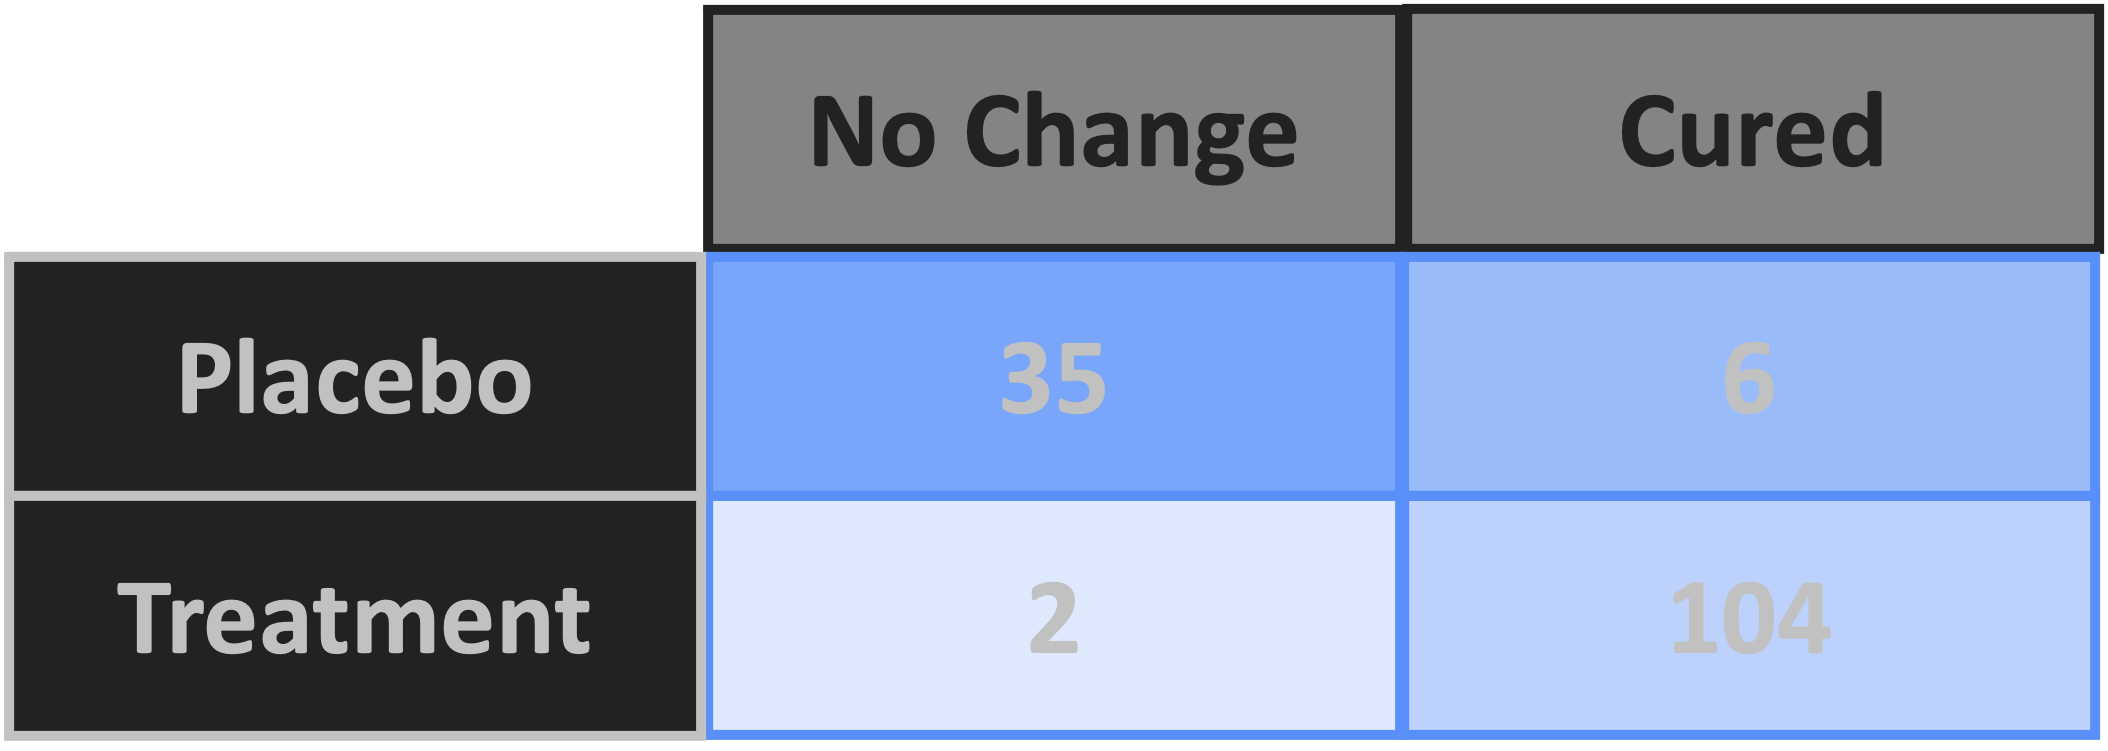
Chi Squared Test
- X & Y both categorical
- Hypothesis: Categories of X affect categories of Y
- H0: Categories of X are not related to categories of Y
- Used in medical contexts and Hardy Weinberg Equillibrium
- You may have encountered this in BIO 102
Temperature Check
How are you Feeling?
Roadmap Reminder
Roadmap Extension: Multiple Xs
Practice: 2-way ANOVA
- New funding source and new hypothesis for your penguin research:
- HA: Penguin body mass differs among species and among islands
- H0: Penguin body mass does not differ with penguin species or island
- Test HA with a 2-way ANOVA
- Was your hypothesis supported?
- What difference(s) do you see between this and a 1-way ANOVA summary table?