Intro to Data Science
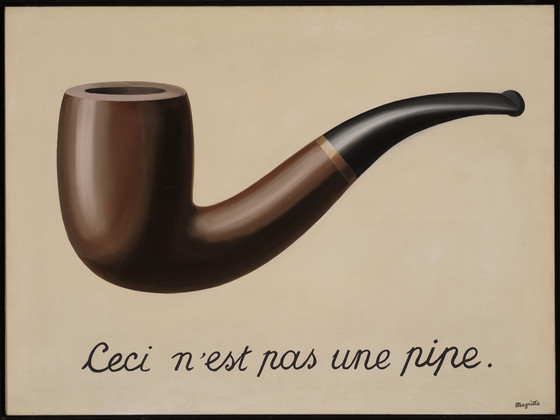
Why Named “Pipe”?
René Magritte – The Treachery of Images (1929)

Practice: Pipe
- Install and load the
magrittrpackage
- Return to your 3-step wrangling of “minnow.csv” from Lecture #3
- Filter “minnow.csv” to only Stonerollers and Chubs
- Convert depth & diameter to meters (from cm)
- Pare down columns to only species and depth/diameter in meters
- Copy these lines and edit them to use the
%>%- Does this have the same end result as the non-pipe lines?
Practice: Summarizing


- Using the “penguins” data in the
palmerpenguinspackage, answer the following questions:
- What is the average bill length in millimeters for each species of penguin?
- Which island has the smallest individual penguin?
- Hint: use body mass
- Which species at which island has the longest flippers for female penguins?
- Hint: remember you can use
filterbefore or aftersummarize!
- Hint: remember you can use
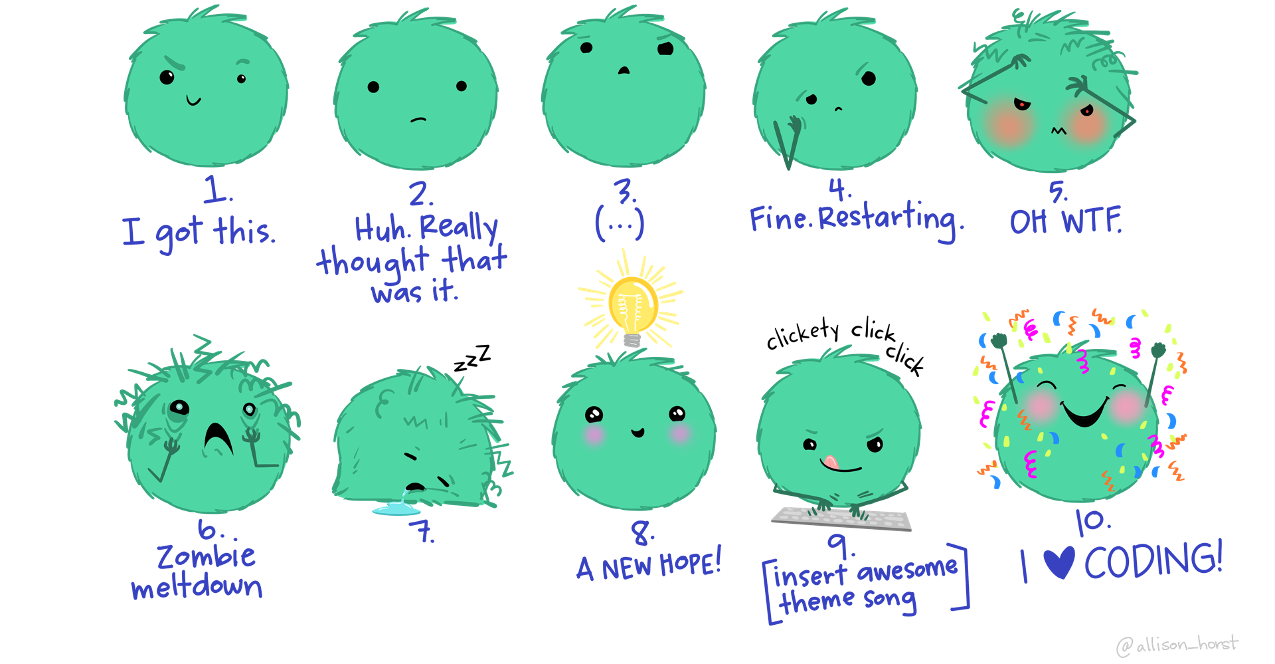
Temperature Check
How are you Feeling?
Nick’s Recommended Packages

stringr – Simple, Consistent Wrappers for Common String Operations
dndR – Dungeons & Dragons Functions for Players and Dungeon Masters
lterpalettefinder – Extract Color Palettes from Photos and Pick Official LTER Palettes


supportR – Support Functions for Wrangling and Visualization
vegan – Community Ecology Package
Forbidden Packages (Sorry!)


dplyr– A Grammar of Data Manipulation- Reason: we cover a lot of this in class
tidyr– Tidy Messy Data- Actually only 2 forbidden functions:
pivot_longer&pivot_wider - Others are okay to use!
- Reason: we just covered both in class
- Actually only 2 forbidden functions:
ggplot2– Create Elegant Data Visualizations Using the Grammar of Graphics- Reason: we cover a lot of this in class (see week 6) and its functions use a really different syntax from what is used by other packages
Temperature Check
How are you Feeling?
Data Shape Visual
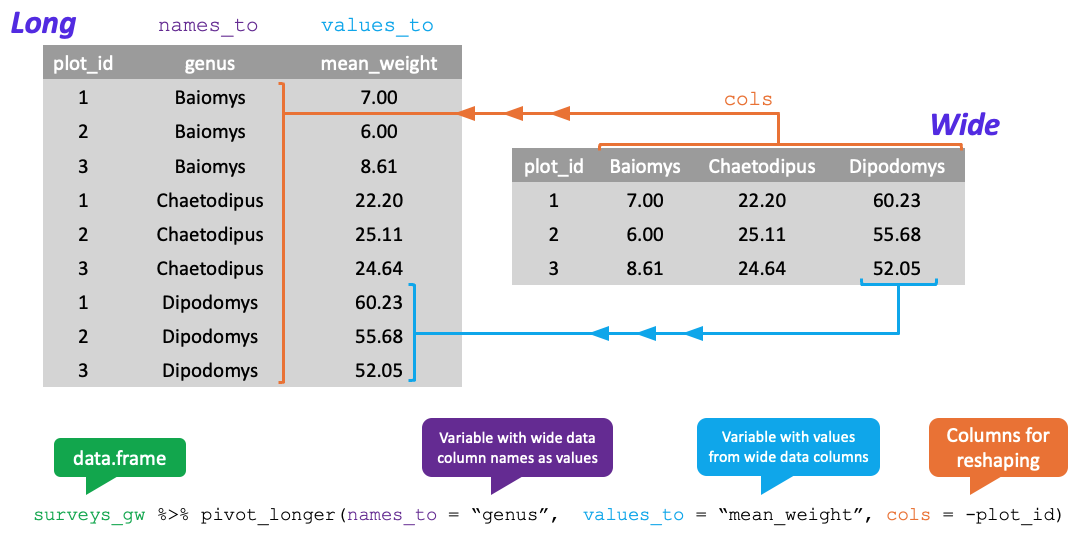
Long Data
Wide Data

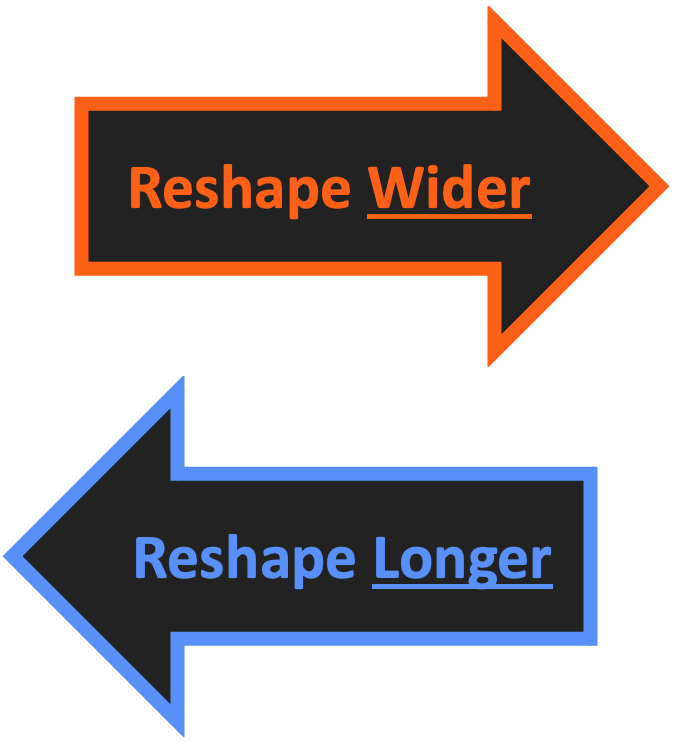
Reshaping Longer Visual
Practice: pivot_longer
- Download the “bees.csv” and load it into R with
read.csv- Check its structure! What columns are there?
- Pivot the data so that you are left with three columns:
- “year”, “bee_group”, and “bee_abundance”
- Check your work! What are the dimensions of the resulting dataframe?
- Should be 32 rows by 3 columns
Reshaping Wider Visual
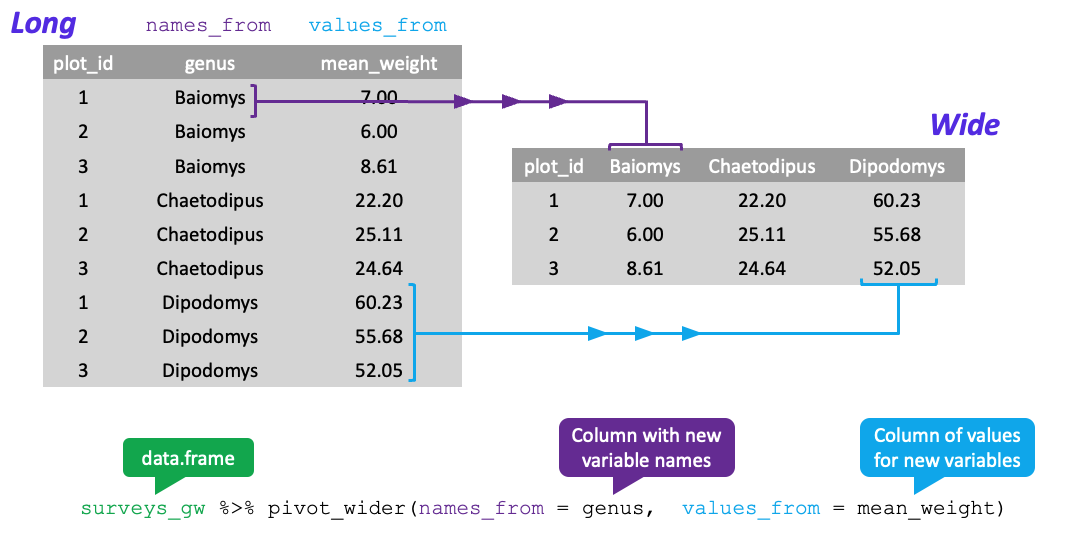
Practice: pivot_wider
- Take the data object you pivoted to long format in the prior practice block
- Pivot it back to wide format with
pivot_wider!
- Check your work!
- Does it look like the original object you loaded with
read.csv?
- Does it look like the original object you loaded with
Practice: Wrangling!
- Beginning with the “penguins” data do the following operations:
- Keep only data on female penguins
- No male penguins and no individuals where sex is not known
- Calculate average bill depth within species and island
- Reshape to wide format so that each island is a column
- Note that if an island doesn’t have a given species it should have
NA(not0)
- Note that if an island doesn’t have a given species it should have
- Check your work! What are the dimensions of the resulting dataframe?
- Should be 6 rows by 5 columns