Publication-Quality Principal Coordinates Analysis (PCoA) Ordinations
Source:R/pcoa_ord.R
pcoa_ord.Rd![[Superseded]](figures/lifecycle-superseded.svg)
This function has been superseded by ordination because this is just a special case of that function. Additionally, ordination provides users much more control over the internal graphics functions used to create the fundamental elements of the graph
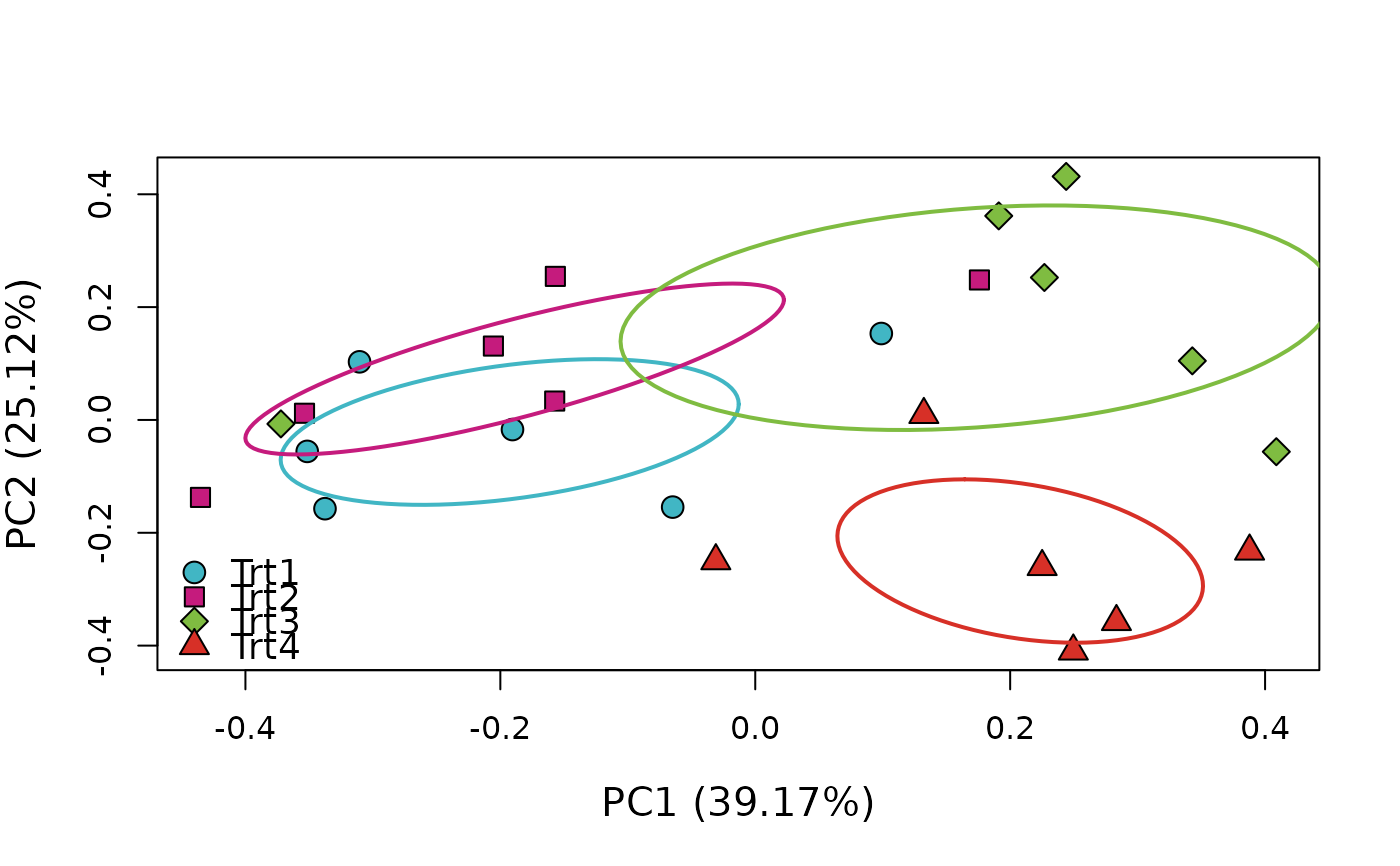
Produces Principal Coordinates Analysis (PCoA) ordinations for up to 10 groups. Assigns a unique color for each group and draws an ellipse around the standard deviation of the points. Automatically adds percent of variation explained by first two principal component axes parenthetically to axis labels. Because there are only five hollow shapes (see ?graphics::pch) all shapes are re-used a maximum of 2 times when more than 5 groups are supplied.
Usage
pcoa_ord(
  mod = NULL,
  groupcol = NULL,
  title = NA,
  colors = c("#41b6c4", "#c51b7d", "#7fbc41", "#d73027", "#4575b4", "#e08214", "#8073ac",
    "#f1b6da", "#b8e186", "#8c96c6"),
  shapes = rep(x = 21:25, times = 2),
  lines = rep(x = 1, times = 10),
  pt_size = 1.5,
  pt_alpha = 1,
  lab_text_size = 1.25,
  axis_text_size = 1,
  leg_pos = "bottomleft",
  leg_cont = unique(groupcol)
)
Arguments
- mod
(pcoa) object returned by
ape::pcoa- groupcol
(dataframe) column specification in the data that includes the groups (accepts either bracket or $ notation)
- title
(character) string to use as title for plot
- colors
(character) vector of colors (as hexadecimal codes) of length >= group levels (default not colorblind safe because of need for 10 built-in unique colors)
- shapes
(numeric) vector of shapes (as values accepted by
pch) of length >= group levels- lines
(numeric) vector of line types (as integers) of length >= group levels
- pt_size
(numeric) value for point size (controlled by character expansion i.e.,
cex)- pt_alpha
(numeric) value for transparency of points (ranges from 0 to 1)
- lab_text_size
(numeric) value for axis label text size
- axis_text_size
(numeric) value for axis tick text size
- leg_pos
(character or numeric) legend position, either numeric vector of x/y coordinates or shorthand accepted by
graphics::legend- leg_cont
(character) vector of desired legend entries. Defaults to
uniqueentries ingroupcolargument (this argument provided in case syntax of legend contents should differ from data contents)
Examples
# \donttest{
# Use data from the vegan package
data("varespec", package = 'vegan')
resp <- varespec

# Make some columns of known number of groups
factor_4lvl <- c(rep.int("Trt1", (nrow(resp)/4)),
                 rep.int("Trt2", (nrow(resp)/4)),
                 rep.int("Trt3", (nrow(resp)/4)),
                 rep.int("Trt4", (nrow(resp)/4)))

# And combine them into a single data object
data <- cbind(factor_4lvl, resp)

# Get a distance matrix from the data
dist <- vegan::vegdist(resp, method = 'kulczynski')

# Perform a PCoA on the distance matrix to get points for an ordination
pnts <- ape::pcoa(dist)

# Test the function for 4 groups
pcoa_ord(mod = pnts, groupcol = data$factor_4lvl)

# }
# }